FIBER OPTIC NETWORK PROBLEMS
Field termination problems are also frequent culprits, often resulting in air gaps, high insertion loss, or surface defects such as scratches and contamination. In fact, contamination—including dust, fingerprints, and oily residues—is the leading cause of fiber failures, as it can lead to excessive signal loss or even permanent damage to the connector end faces.
Other possible issues include faulty fusion splices, misalignment, or incorrect polarity. Poor cable management can also strain connectors, causing misalignment, or prevent connectors from seating properly with their mates. Damaged or worn latching mechanisms on connectors or adapters are sometimes to blame as well. Within the fiber link, microbends, macrobends, or breaks along the fiber can cause disruptions.
Even if all connectors are clean, high quality, and correctly terminated, poor cable plant design can lead to insertion loss and performance issues. Too many connections in a channel can push signal loss above acceptable levels for certain applications. Exceeding multimode fiber distance limits may also cause high modal dispersion, impacting performance.
Identifying and Diagnosing Fiber Optic Issues
To effectively diagnose these problems, network professionals typically use a range of tools, including Optical Time-Domain Reflectometers (OTDRs), Visual Fault Locators (VFLs), and Power Meters.
OTDR
An OTDR is a sophisticated electronic test instrument used to characterize optical fibers. It operates by injecting a series of light pulses into the fiber and analyzing the returning light that is reflected back due to scattering and Fresnel reflections.
The OTDR provides a detailed picture of the fiber link, displaying a trace or graphical representation of the fiber's performance. This trace reveals the fiber’s overall length, the location and type of events (such as splices, connectors, bends, or breaks), and the loss associated with each event.
Interpreting OTDR Traces
Reading and understanding an OTDR trace is a critical skill for fiber technicians. A typical trace shows a gradual decline in signal strength due to attenuation and distinct spikes at points of reflection. Loss measurements at these events provide insights into the quality of splices, connectors, and the fiber itself. Recognizing patterns in the trace—such as abrupt drops or irregular spikes—helps diagnose specific issues like breaks, macrobends, or dirty end-faces.
Enhancing OTDR Accuracy
The light reflected back to an OTDR for analysis represents only a minuscule fraction of the original test pulse, requiring the OTDR's receiver to be highly sensitive. However, the OTDR's own connector generates a significant reflection, which can temporarily overwhelm the receiver, much like a camera flash can momentarily blind your eyes. To address this, a launch cable is inserted between the OTDR and the first connection in the fiber link.
This launch cable provides the receiver with sufficient time to recover from the initial reflection and be ready to detect the next signal. The cable's length must be adequate to accommodate the pulse widths required for testing longer fibers, typically at least 100 meters. With this setup, the OTDR trace will show backscatter before and after the first connection, enabling accurate measurement of the initial connector's performance.
At the other end of the fiber, the final connection generates a strong reflection due to the abrupt transition from glass to air. After this point, the lack of fiber causes the backscatter to drop to the OTDR’s noise floor, making it impossible to assess the last connection accurately. To address this, a receive cable (or tail cable) is used at the far end. This cable extends the fiber link, creating a backscatter reference beyond the final connection. As a result, the OTDR can measure the loss of the last connection with precision.
For clean test reports, technicians typically exclude the launch and receive cables from their measurements. Most OTDRs offer compensation features that allow users to “remove” these cables from the results, ensuring that only the data from the actual fiber link under test is recorded. This ensures clarity and accuracy in reporting, making it easier to evaluate the fiber's performance.
Understanding OTDR Readings and Advanced Analysis
An Optical Time Domain Reflectometer (OTDR) provides a detailed graphical representation of fiber performance along its length. While these traces may appear complex at first glance, they offer valuable insights into the link, with dips and spikes pinpointing specific events like connectors, splices, or the fiber’s endpoint.
For experienced technicians, reflective events are easy to identify, whether they stem from tester connectors, splices, or mismatched fibers. They also recognize that faint blips following the fiber's end are often "ghosts"—artifacts of high reflectance rather than actual issues.
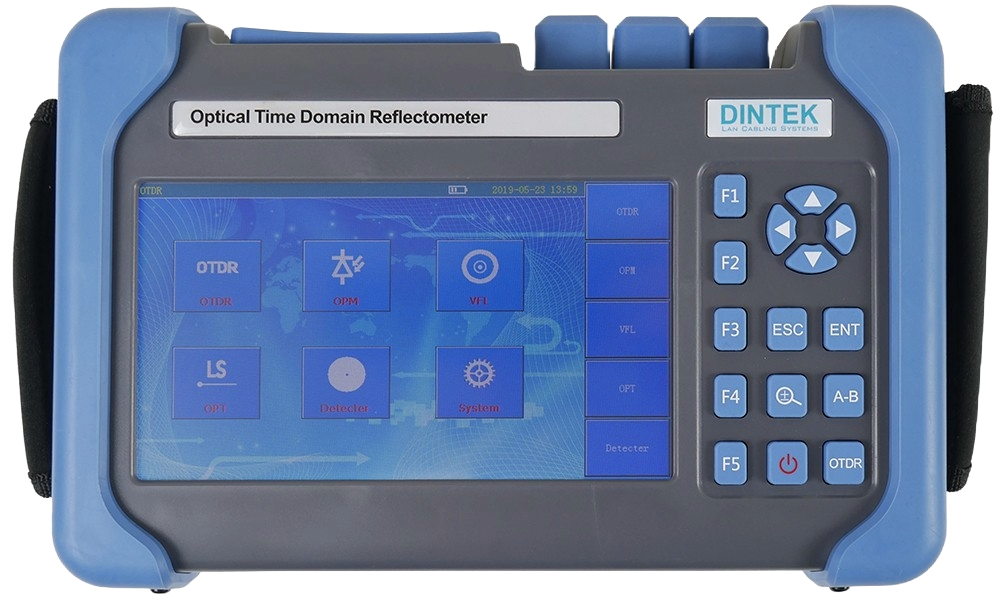
For less seasoned users, modern OTDRs, such as DINTEK's Optical Time Domain Reflectometer, simplify trace interpretation by providing a visual Event Map. This feature categorizes events and flags problematic areas with red icons, making troubleshooting more intuitive and efficient.
Pulse Width Adjustment
Pulse width plays a critical role in balancing detection range and event resolution. A longer pulse width delivers more power, enabling measurements over greater distances. However, it also increases the “dead zone,” the minimum spacing between two detectable events. For example, a narrow 3 ns pulse can detect events only 0.6 meters apart, while a broader 1000 ns pulse requires at least 200 meters between events. Selecting the right pulse width depends on the fiber's length and the spacing of critical points.
Testing at Multiple Wavelengths
Using various wavelengths enhances the ability to detect fiber stress, bends, or cracks. For multimode fibers, testing at 850 nm and 1300 nm is recommended, while singlemode fibers require 1300 nm and 1550 nm. Stress-related issues are often more evident at higher wavelengths, making this testing essential even if only lower wavelengths are used during regular operations. In cases where problems are suspected at a splice-on pigtail, visual fault locators (VFLs) can differentiate between a damaged fiber and connector issues.
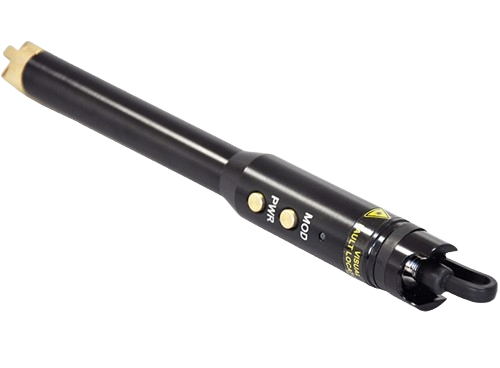
Beyond basic troubleshooting, a VFL can pinpoint breaks, macrobends from kinks, and poor splice points. Its bright red light is often visible through the fiber jacket at fault locations, especially in low-light environments. This makes it particularly helpful for locating defective splices inside splice enclosures.
Visual Fault Locator (VFL)
One of the most straightforward tools for fiber troubleshooting is the Visual Fault Locator (VFL). Compact and cost-effective, it’s an essential item in any fiber technician’s toolkit. DINTEK’s Pen-Type VFL uses a highly visible red laser light, unlike the infrared light typically employed by active network systems, making it easy to identify issues with the naked eye.
The VFL is particularly useful for checking continuity and polarity along a link, identifying breaks in cables, connectors, and splices, and tracing fibers within a rack. It can even verify the quality of field-term connector installations. If light from the VFL escapes through the connector window, it indicates improperly mated fiber ends, highlighting an incorrect termination.
Many VFLs offer both continuous and flashing light modes, helping technicians quickly distinguish between fibers or locations. With adapters available for various connector types, a single VFL can handle 2.5mm connectors like SC, ST, and FC, as well as 1.25mm connectors such as LC and MU. Key considerations when selecting a VFL include durability, battery life, and compatibility with your specific field requirements.
Although a VFL is considered a basic troubleshooting tool compared to OTDRs, it complements them effectively. A VFL can isolate faults that are too close together or within the OTDR’s “dead zone.” This capability is especially valuable for detecting bad splices near the end of the link when working with splice-on pigtails.
Power Meter
Optical power meters are indispensable tools for diagnosing fiber optic network issues. By measuring the power levels of optical signals, they provide accurate insights into the performance of fiber links. The device typically consists of a calibrated sensor, an amplifier, and a display unit, all designed to measure the light output in decibels (dBm). This precision allows technicians to verify whether the signal strength is within the acceptable range for efficient communication, ensuring that fiber optic cables deliver optimal performance without excess attenuation or signal loss.
One of the key advantages of using an optical power meter is its ability to detect signal loss along the fiber path. By testing at both the transmitter and receiver ends, technicians can identify discrepancies in power levels that indicate potential issues such as bends, breaks, or dirty connectors. Pairing the optical power meter with a stable light source further enhances its diagnostic capabilities, enabling end-to-end testing of the fiber link. If excessive power loss is detected, the meter helps pinpoint the location of the problem, saving valuable time during troubleshooting.
Optical power meters are also useful for diagnosing equipment-related problems in fiber optic systems. Incompatible transmitter power levels or malfunctioning devices can disrupt network performance. By measuring the output directly from optical transmitters, the meter ensures the devices are functioning within their specified parameters. Additionally, it aids in validating that splices, connectors, and patch cords meet the required standards. With this versatility, optical power meters play a critical role in maintaining network reliability and ensuring quick resolution of fiber optic issues.
Conclusion
In conclusion, addressing fiber optic network problems effectively requires a thorough understanding of their causes and the appropriate tools to resolve them. Issues such as attenuation, misaligned connectors, damaged cables, and external interferences can disrupt network performance, but modern diagnostic tools like Optical Time-Domain Reflectometers (OTDRs), Visual Fault Locators (VFLs), and Optical Power Meters provide precise and efficient solutions. OTDRs excel at mapping and pinpointing faults along the cable length, while VFLs offer a straightforward visual check for breaks or misalignments. Optical Power Meters ensure the signal strength is within acceptable limits, confirming the network’s operational integrity.
By combining these tools with regular maintenance practices and meticulous handling of fiber optics, network operators can prevent many common issues from escalating into costly outages. The proactive use of diagnostic equipment allows for faster troubleshooting and system recovery, ensuring reliable and high-speed connectivity. As fiber optic networks become increasingly central to communication infrastructure, investing in proper tools and techniques is essential for maintaining their performance and minimizing downtime.


